Workflow
BasicSpanner exposes the full analysis pipeline through a single graphical interface organized in two sidebars and a central viewer.
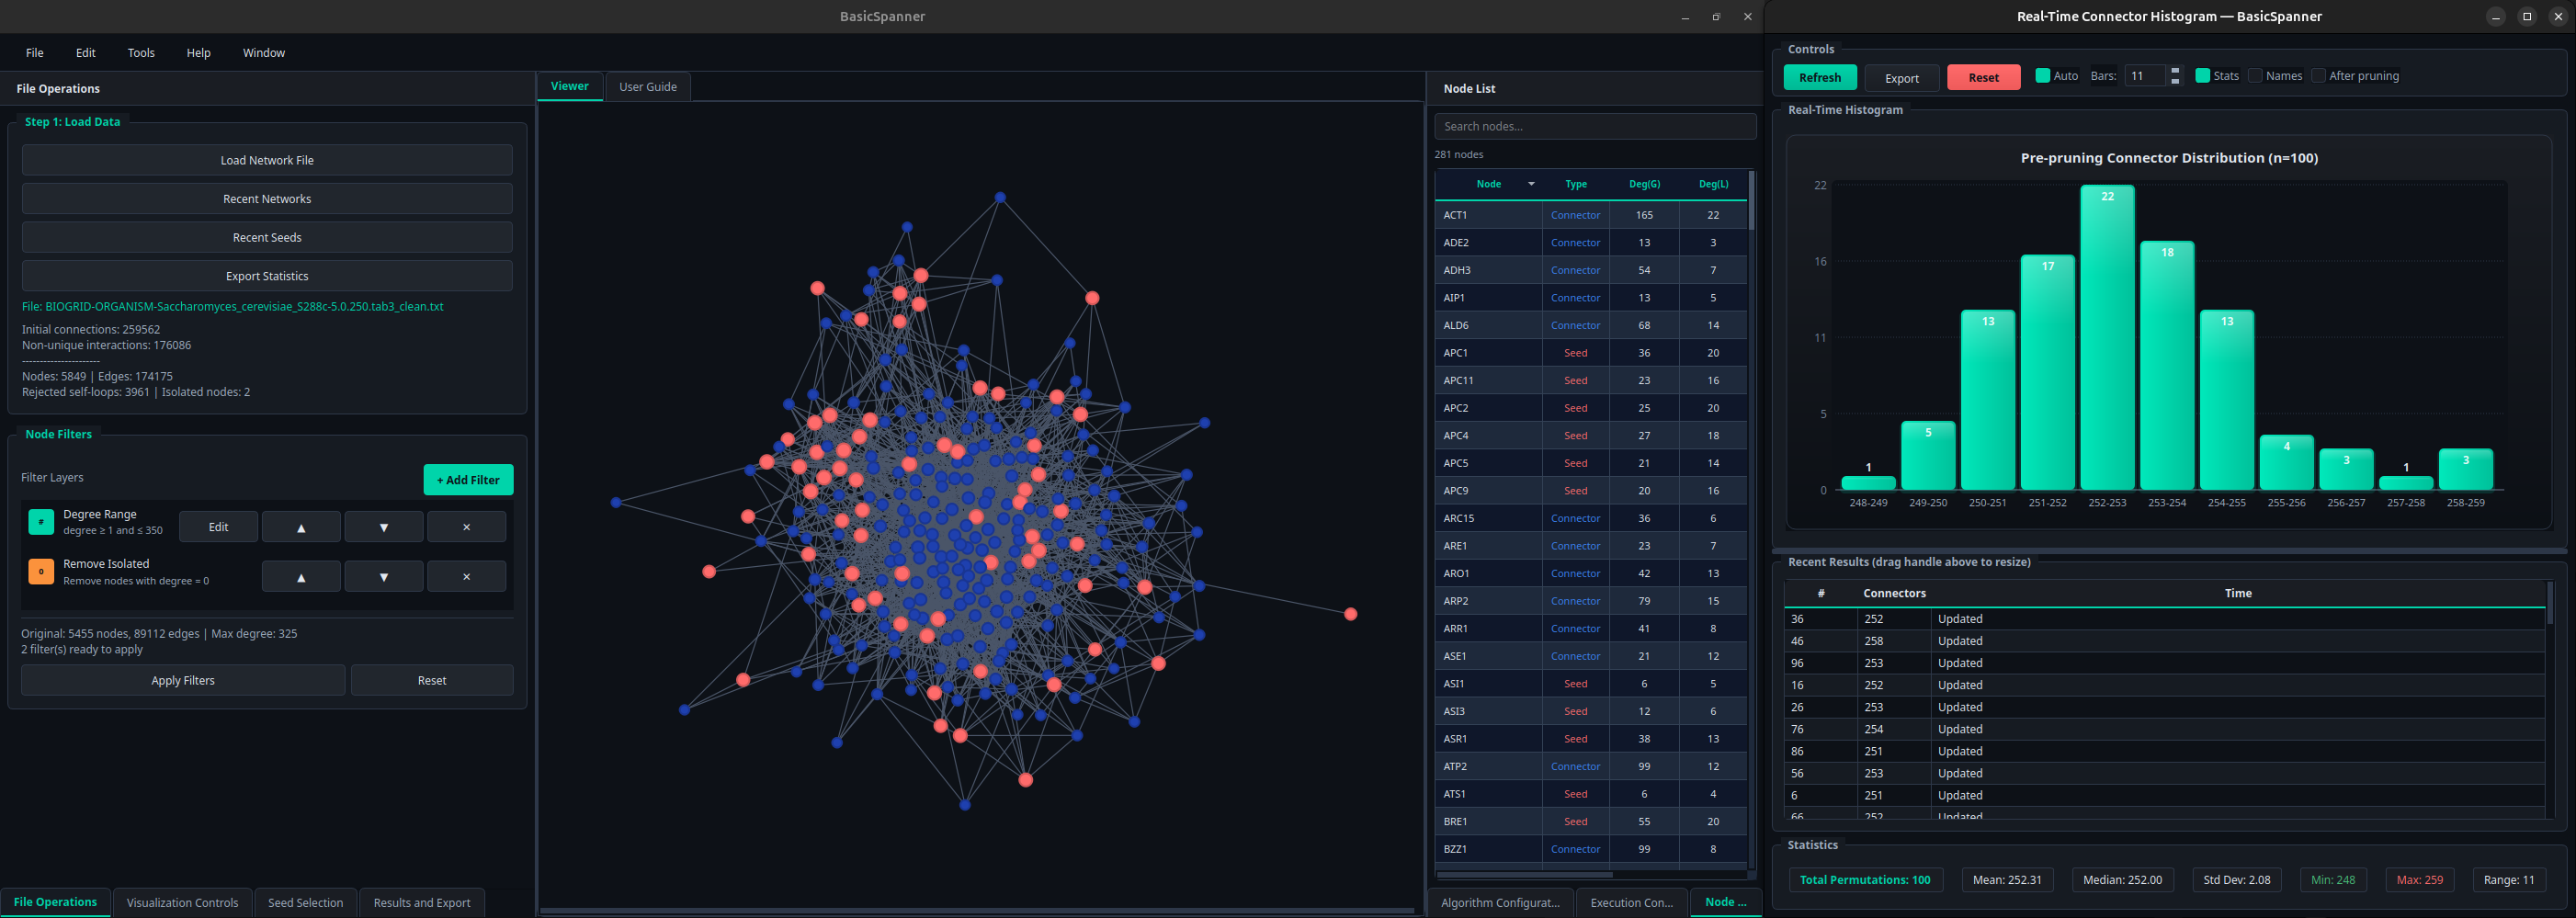
Central viewer
The Viewer displays the current network using the layout selected in the Visualization Controls panel (Automatic, Circular, Yifan Hu, Spring Force, Hierarchical, Grid or Random). Seeds are drawn in red, connectors in blue. Nodes can also be colored according to degree or different centrality measures (closeness, betweenness, clustering coefficient, PageRank).
Next to the viewer, the Node List tabulates every visible unit with its degree in the global network and in the basic network.
Bottom tabs
- Visualization Controls: layout algorithm, parameters, view mode (Basic network vs. full graph).
- Seed Selection: loading from file or random generation.
- Algorithm Configuration: number of replicates, replicate mode, threads, pruning.
- Execution: start, pause and cancel analyses.
- Results and Export: per-replicate table, summary statistics and export controls.
Real-time histogram
During execution a floating window displays a histogram of connector counts as each replicate finishes, along with summary statistics (mean, median, standard deviation, range) and the raw per-replicate values. The histogram and table can be exported independently from the rest of the outputs.
Typical pipeline
- Import the network.
- Apply filters.
- Load or generate seeds.
- Configure replicates, threads and pruning.
- Run the analysis.
- Inspect the basic network and the distribution of connector counts.
- Export the edges, the node metrics and the Gephi metadata.